Today, guest blogger and Certified Consultant Nagi Elabbasi of Veryst Engineering shares simulation research designed to optimize band gaps for phononic crystals.
Phononic crystals are rather unique materials that can be engineered with a particular band gap. As the demand for these materials continues to grow, so does the interest in simulating them, specifically to optimize their band gaps. COMSOL Multiphysics, as we’ll show you here, can be used to perform such studies.
What Is a Phononic Crystal?
A phononic crystal is an artificially manufactured structure, or material, with periodic constitutive or geometric properties that are designed to influence the characteristics of mechanical wave propagation. When engineering these crystals, it is possible to isolate vibration within a certain frequency range. Vibration within this selected frequency range, referred to as the band gap, is attenuated by a mechanism of wave interferences within the periodic system. Such behavior is similar to that of a more widely known nanostructure that is used in semiconductor applications: a photonic crystal.
Optimizing the band gap of a phononic crystal can be challenging. We at Veryst Engineering have found COMSOL Multiphysics to be a valuable tool in helping to address such difficulties.
Setting Up a Phononic Band Gap Analysis
When it comes to creating a band gap in a periodic structure, one way to do so is to use a unit cell composed of a stiff inner core and a softer outer matrix material. This configuration is shown in the figure below.
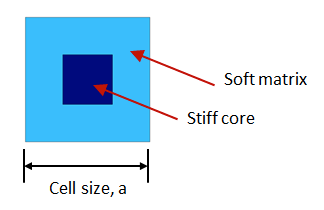
A schematic of a unit cell. The cell is composed of a stiff core material and a softer outer matrix material.
Evaluating the frequency response of a phononic crystal simply requires an analysis of the periodic unit cell, with Bloch periodic boundary conditions spanning a range of wave vectors. It is sufficient to span a relatively small range of wave vectors covering the edges of the so-called irreducible Brillouin zone (IBZ). For rectangular 2D structures, the IBZ (shown below) spans from Γ to X to M and then back to Γ.
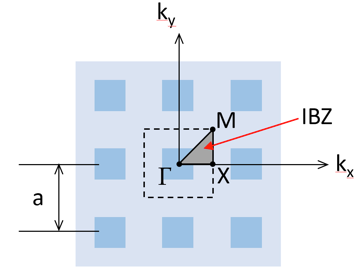
The irreducible Brillouin zone for 2D square periodic structures.
The Bloch boundary conditions (known as the Floquet boundary conditions in 1D), which constrain the boundary displacements of the periodic structure, are as follows:
where kF is the wave vector.
The source and destination are applied once to the left and right edges of the unit cell and once to the top and bottom edges. This type of boundary condition is available in COMSOL Multiphysics. Due to the nature of the boundary conditions, a complex eigensolver is needed. The system of equations, however, is Hermitian. As such, the resulting eigenvalues are real, assuming that no damping is incorporated into the model. The COMSOL software makes this step rather easy, as it automatically handles the calculation.
We set up our eigensolver analysis as a parametric sweep involving one parameter, k, which varies from 0 to 3. Here, 0 to 1 defines a wave number spanning the Γ-X edge, 1 to 2 defines a wave number spanning the X-M edge, and 2 to 3 defines a wave number spanning the diagonal M-Γ edge of the IBZ. For each parameter, we solve for the lowest natural frequencies. We then plot the wave propagation frequencies at each value of k. A band gap appears in the plot as a region in which no wave propagation branches exist. Aside from very complex unit cell models, completing the analysis takes just a few minutes. We can therefore conclude that this approach is an efficient technique for optimization if you are targeting a certain band gap location or if you want to maximize band gap width.
Performing the Optimization Studies
To illustrate such an application, we model the periodic structure shown above, with a unit cell size of 1 cm × 1 cm and a core material size of 4 mm × 4 mm. The matrix material features a modulus of 2 GPa and a density of 1000 kg/m3. The core material, meanwhile, has a modulus of 200 GPa and a density of 8000 kg/m3. The figure below shows no wave propagation frequencies in the range of 60 to 72 kHz.
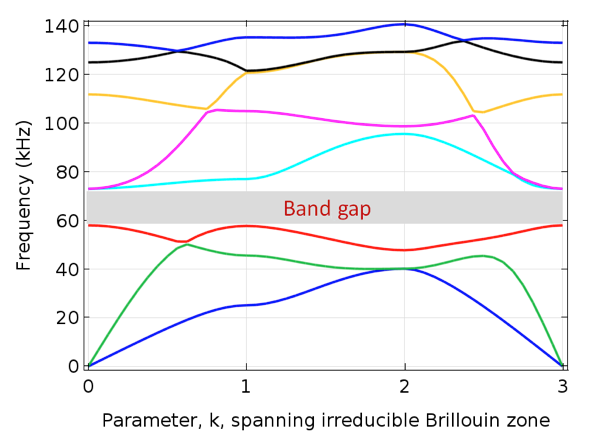
The frequency band diagram for selected unit cell parameters.
To demonstrate the use of the band gap concept for vibration isolation, we simulate a structure consisting of 11 x 11 cells from the periodic structure analyzed above. These cells are subjected to an excitation frequency of 67.5 kHz (in the band gap).
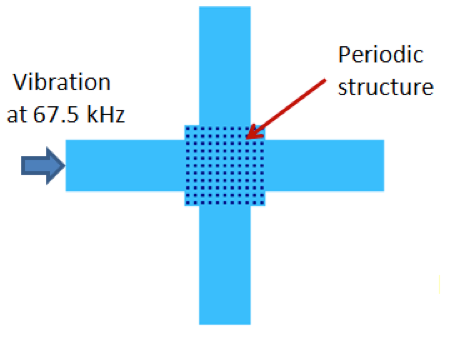
The structure used to illustrate vibration isolation for an applied frequency in the band gap.
The animation below highlights the response of the cells. From the results, we can gather how effective the periodic structure is at isolating the rest of the structure from the applied vibrations. The vibration isolation is still practically efficient, even if fewer periodic cells are used.
An animation of the vibration response at 67.5 kHz.
Note that at frequencies outside of the band gap, the periodic structure does not isolate the vibrations. These responses are depicted in the figures below.
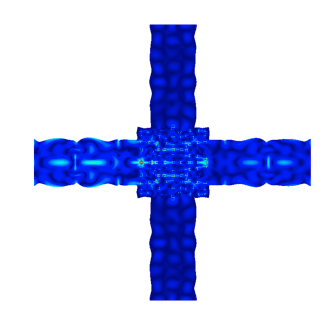
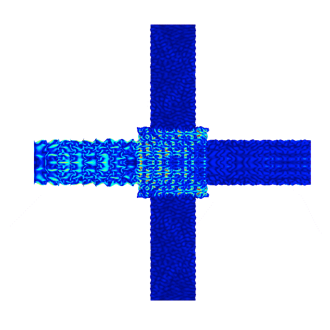
The vibration response at frequencies outside of the band gap. Left: 27 kHz. Right: 88 kHz.
To learn more about the 2D band gap model presented here, head over to the COMSOL Exchange, where it is available for download.
References
- P. Deymier (Editor), Acoustic Metamaterials and Phononic Crystals, Springer, 2013.
- M. Hussein, M. Leamy, and M. Ruzzene, Dynamics of Phononic Materials and Structures: Historical Origins, Recent Progress, and Future Outlook, Appl. Mech. Rev 66(4), 2014.
About the Guest Author